ITC Sustainability Report 2008
Chairman’s Statement:
ITC’s Vision and Strategy
ITC:
Organisational Profile
Certifications, Honours & Awards Report
Parameters
Governance, Commitments & Engagements
ITC’s Triple Bottom Line GRI Index Statement from
Ernst & Young
Annexures Self-declaration on Application Level
«»

ENVIRONMENTAL PERFORMANCE

Almost a quarter of energy used in ITC is from Renewable Resources

Visual representation showing Sources of Energy in ITC for the Financial Year 2007-08Not only do we produce 95.6% of our energy requirements internally, 24.1% of the total energy is generated from renewable resources – as defined by IPCC.

In 2007-08, renewable component of energy improved from 3437 TJ to 3571 TJ (an improvement of 3.9% over the previous year). Better utilisation of black liquor at the Bhadrachalam unit contributed significantly to this improvement.

Renewable energy resources in ITC comprise

  • Black liquor - waste from papermaking process in Bhadrachalam Paperboards unit.

  • Locally sourced chip/sawdust and de-oiled bran in Kovai unit.

  • Wind Energy for ITC Hotel Kakatiya.

  • Solar thermal systems for preheating boiler feed water and canteen hot water in a number of our units.

A Positive Carbon footprint

We 
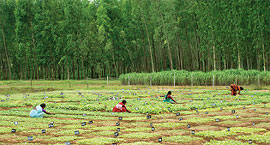
continued to enlarge our farm and social forestry programmes and added nearly 15,000 hectares of plantations in 2007-08. The total farm and social forestry plantations, as at March 31, 2008, covered an area of over 80,000 hectares.

Apart from providing sustainable source of raw materials for our Paperboards business and providing 35 million man days of employment to marginal sections of society, these plantations sequestered 2638 kilotonnes of CO2, thereby consolidating our 'Carbon Positive' status for the third successive year.

Higher CO2 emission in 2007-08 were due to significant growth in almost all the businesses, large scale project activities and inclusion of 4 subsidiary companies’ performance in this Report.

  Unit 03-04 04-05 05-06 06-07 07-08
CO2 released
(Manufacturing and Freight)
Kilotonne 1013 1058 1202 1143 1352
CO2
sequestered
Kilotonne 311 906 1244 2025 2638
Percent 31% 86% 104% 177% 195%
Image of Graph showing CO2 sequestered and CO2 released by ITC from the Financial Year 2003-04 to 2007-08

Global Warming – Kyoto Protocol - Clean Development Mechanism

In line with our strategy to combat the impact of climate change, our Paperboards & Specialty Papers and Hotels businesses have implemented a number of CDM projects.

Seven of these projects have already been registered with the CDM Executive Board of UNFCCC. Many additional CDM projects, including one on ‘social forestry plantations’ are in various stages of registration.

 
«»
Chairman’s Statement:
ITC’s Vision and Strategy
ITC:
Organisational Profile
Certifications, Honours & Awards Report
Parameters
Governance, Commitments & Engagements
ITC’s Triple Bottom Line GRI Index Statement from
Ernst & Young
Annexures Self-declaration on Application Level
  
Sustainability Reports Archives
Sustainability Report 2013 | Sustainability Report 2012 | Sustainability Report 2011 | Sustainability Report 2010
Sustainability Report 2009 | Sustainability Report 2008 | Sustainability Report 2007 | Sustainability Report 2006
Sustainability Report 2005 | Sustainability Report 2004