ITC Limited
Sustainability Report 2012
Economic Performance
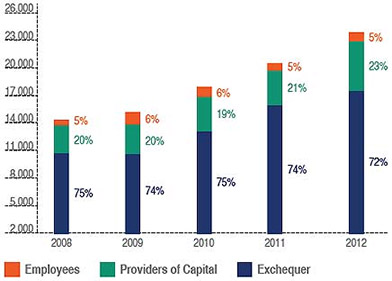
Analysis of Value AddedDistribution of Value Added |
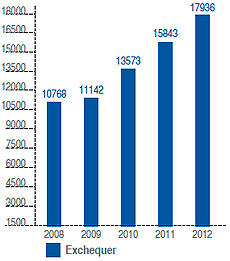
Contribution to the National ExchequerContribution to Exchequer |
|||||||
|
The Company’s excise payments account for almost 7% of the total excise revenue of the Government of India. In the area of income tax, the Company is the highest tax payer in eastern India and among the top tax payers in the nation.
|
|||||||
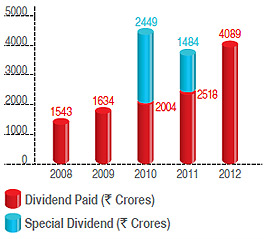
Dividend Payout |
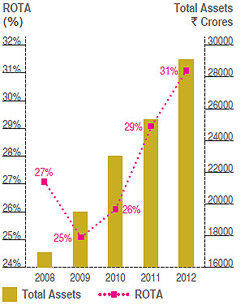
Return on Total Assets |
|||||||
ITC is one of India’s most admired and valuable corporations and has consistently featured, over the last 16 years, amongst the top 10 private sector companies in terms of market capitalisation and profits and is amongst the most influential stocks in the Indian equity market. During the current year, it has declared a dividend of Rs. 4.50 per share of Re. 1 each. |
ITC has been delivering higher rates of return on total assets even as its balance sheet size (peaking at Rs.28966 Crores in the current year) has grown at a compound rate of 14% since 2007-08.
Return on Total Assets
|
|||||||
| Dividend Paid (Incl . Dividend Distribution Tax)  |
||||||||
|
Rs. 1,80,000
Crores
market capitalisation 31% return on total
assets in 2011-12 Rs. 4.50
dividend per share
in the current year |
||||||||


