ITC Limited
Sustainability Report 2012

Environmental Performance
Water Management
 Enlarging a Water Positive Footprint

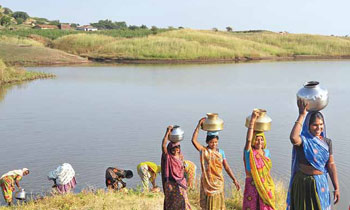 The continued focus on rainwater harvesting both in the Company premises and socially relevant watershed areas has enlarged our water positive footprint.
As on March 31, 2012, ITC’s Watershed Projects covering nearly 90,000 Hectares of land, support the Water Positive status of the Company for the 10th year in a row. The total rainwater harvesting potential so far created by the Company is over two times the net water consumption by our operations.
| WATER BALANCE AT ITC | 2002-03 | 2003-04 | 2004-05 | 2005-06 | 2006-07 | 2007-08 | 2008-09 | 2009-10 | 2010-11 | 2011-12 |
| Fresh water intake | 24.10 | 22.48 | 24.98 | 25.58 | 25.79 | 27.46 | 32.72 | 29.96 | 29.36 | 29.02 |
| Treated effluents discharged | 14.64 | 14.04 | 19.55 | 20.96 | 19.58 | 18.92 | 24.52 | 23.41 | 22.21 | 22.80 |
| Percentage of treated effluent utilised for irrigation by nearby farming community | ** | ** | 86.90 | 86.80 | 80.50 | 79.40 | 72.30 | 84.80 | 60.70 | 68.50 |
| Net water consumption | 9.49 | 8.44 | 5.43 | 4.62 | 6.21 | 8.54 | 8.20 | 6.55 | 7.15 | 6.22 |
| RWH potential created within ITC units | 0.24 | 0.39 | 0.34 | 0.61 | 0.47 | 0.42 | 0.50 | 0.42 | 0.92 | 0.67 |
| RWH potential created through watershed projects (cumulative for that year) | 12.50 | 15.67 | 16.52 | 18.99 | 23.12 | 25.42 | 19.43 | 20.18 | 18.97 | 20.38 |
| Total RWH potential created (for the year) | 12.74 | 16.06 | 16.86 | 19.60 | 23.59 | 25.84 | 19.93* | 20.60* | 19.89* | 21.05* |
| * ‘RWH potential’ figures account for silt deposits in various watershed structures. The adjustments are based on actual sample measurements & the extent of silt deposit depends on the age & location of a structure | ||||||||||
| ** Not available | All figures in Million KL, except percentage | |||||||||