
Environmental Performance
Significant Air Emissions
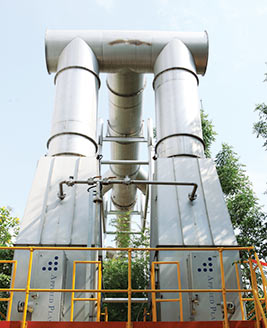 ITC continued to invest in reducing air emission levels through adoption of cleaner technologies/fuels, monitoring of combustion efficiencies and investment in state-of-the-art pollution control equipment such as plasma filters, electrostatic precipitators etc.
All our Units monitor significant air emission parameters such as Particulate Matter (PM), Nitrogen Oxides (NOX) and Sulphur Dioxide (SO2) on a regular basis, to ensure compliance with internal norms that are more stringent than regulatory requirements.
In 2011-12, the total significant air emissions included 701 tonnes of Particulate Matter (PM), 732 tonnes of NOX and 841 tonnes of SO2 emissions (In 2010-11, PM: 765, NOX: 874 and SO2: 1133 tonnes). The decrease in the total emissions over the last year is due to reduced use of internally generated energy from fossil fuels in ITC and better utilisation of energy from renewable sources.
In 2011-12, Particulate Matter emissions from Bhadrachalam were 1 kg per BDMT (Bone-Dry Metric Tonne) of production, an improvement of 24.2% over the previous year (1.32 kg/BDMT in 2010-11). As per the report by Centre for Science & Environment, large-scale Indian mills typically emit 3.8 kg/BDMT (Source: ‘All About Paper – The life cycle of Indian Pulp and Paper Industry’, Green Rating project, 2004).
In 2011-12, the specific NOX emission in Bhadrachalam was better than the standards stipulated in European countries, as illustrated below: |
The Bhadrachalam Unit is also continuously progressing towards achieving international standards on specific SO2 emission levels, as given below: |
|||||||||||||||||||||||||||||||||||||||||||||||||||||||||||||||||||||||||||||||||||||||||||||||||||||||||||||||||||||||||||||||||
|
|
|||||||||||||||||||||||||||||||||||||||||||||||||||||||||||||||||||||||||||||||||||||||||||||||||||||||||||||||||||||||||||||||||