This Report is best viewed on the latest browsers - IE 10 & above, Chrome 40 & above and Mozilla 32 & above.
GRI - G4 COMPLIANT
In Accordance - Comprehensive

Environmental Performance

Management Approach| Energy| Air Emissions| Water Management| Recycling and Waste Management| Raw Materials| Biodiversity

Air Emissions

Management Approach

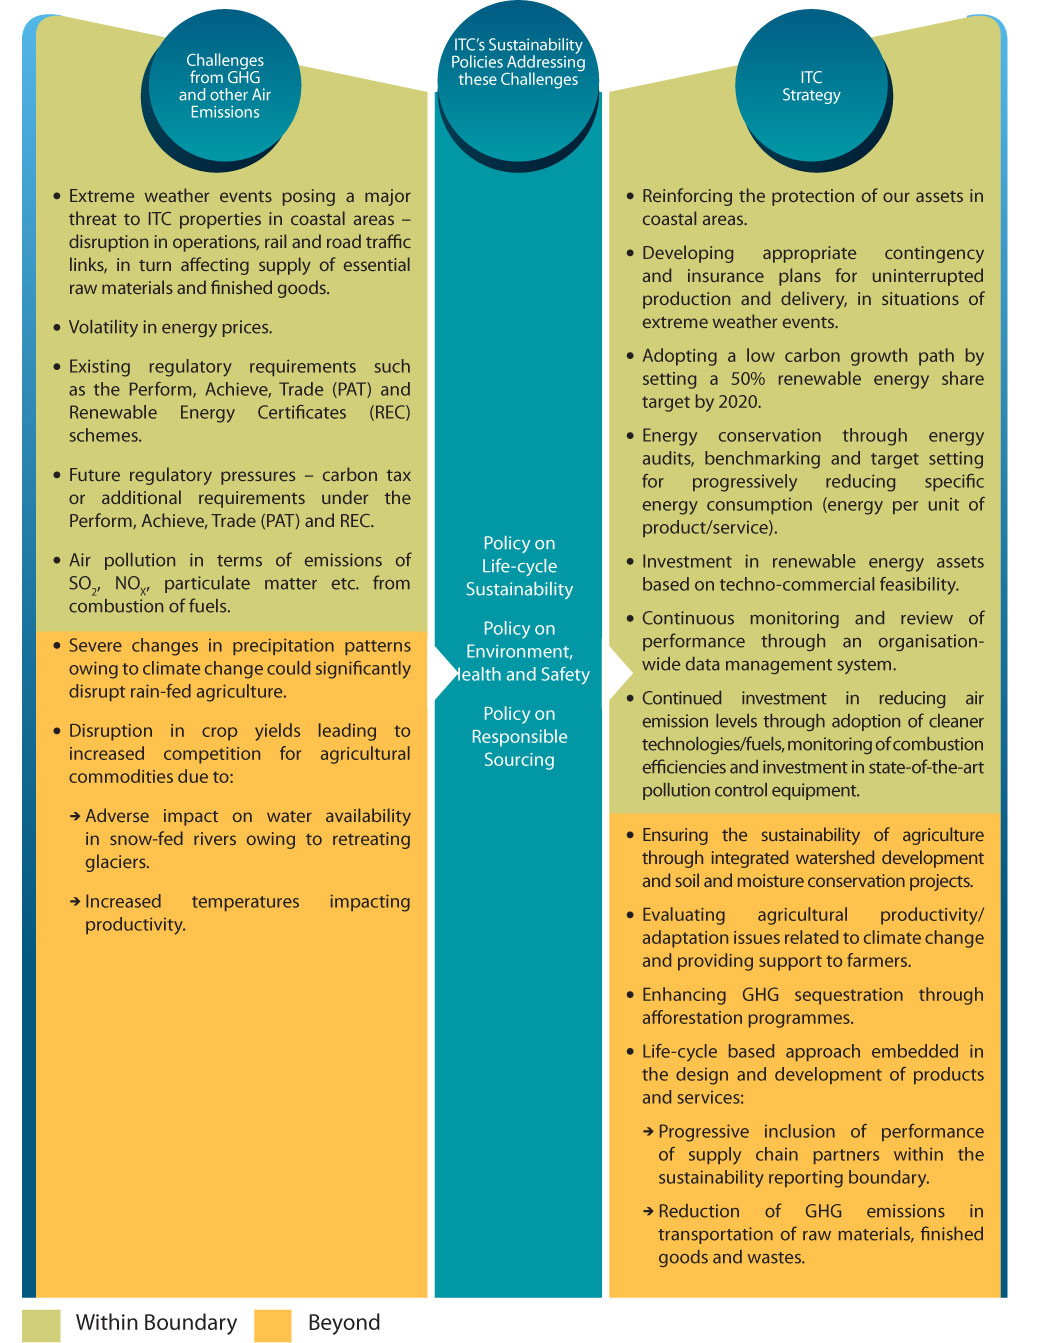
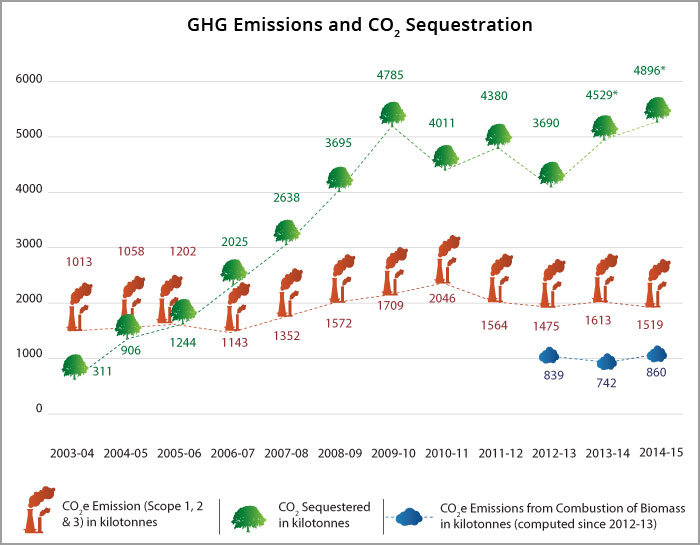
The adverse impact on the environment due to air emissions is complex, long-term and inter-related. Climate change caused by Greenhouse Gas (GHG) emissions has already begun to change precipitation patterns across the globe including in India, thereby disrupting yields in primarily rain-fed Indian agriculture. Since most of ITC's businesses depend significantly on agri-inputs, disruption in crop yields and consequent competition for agricultural commodities, has wide-ranging implications on ITC and its stakeholders. Recognising the fact that is necessary to play an active role on the issue of climate change, ITC has focused on progressively increasing its renewable energy share and enhancing sequestration of GHGs aligned with Government of India's National Action Plan on Climate Change.

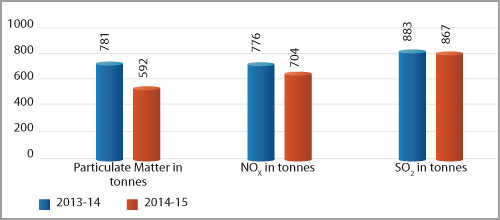
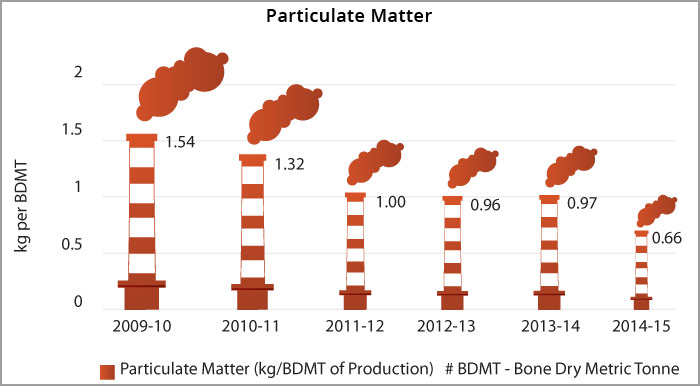
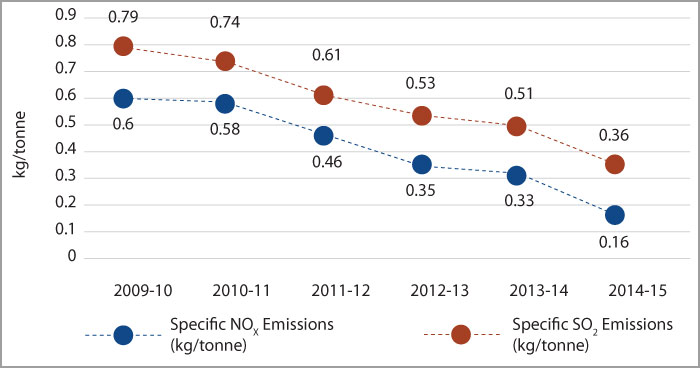
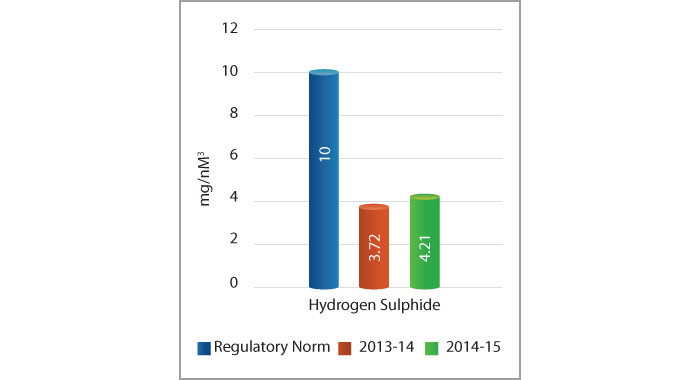
Another aspect linked with rapid industrialisation and urbanisation is the problem of air pollution in terms of emissions of SO2, NOx and particulate matter that has become a very serious health issue across almost the entire urban landscape in India. This not only has huge adverse impacts on health of human beings but also on the biodiversity of a region. ITC has continued to invest in reducing air emission levels through focus on cleaner technologies/combustion efficiency improvement while simultaneously reducing specific energy consumption and increasing ITC's renewable energy share.

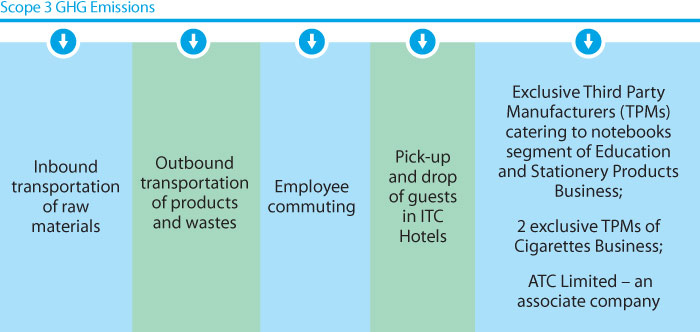
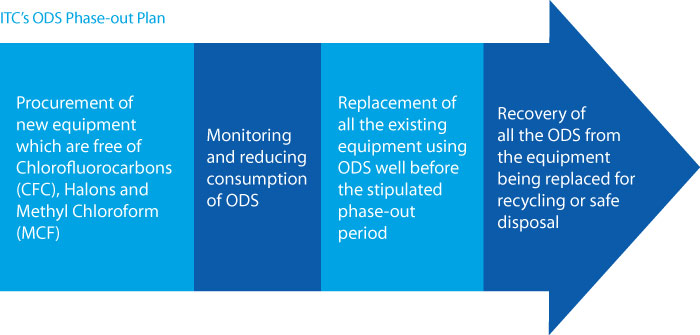
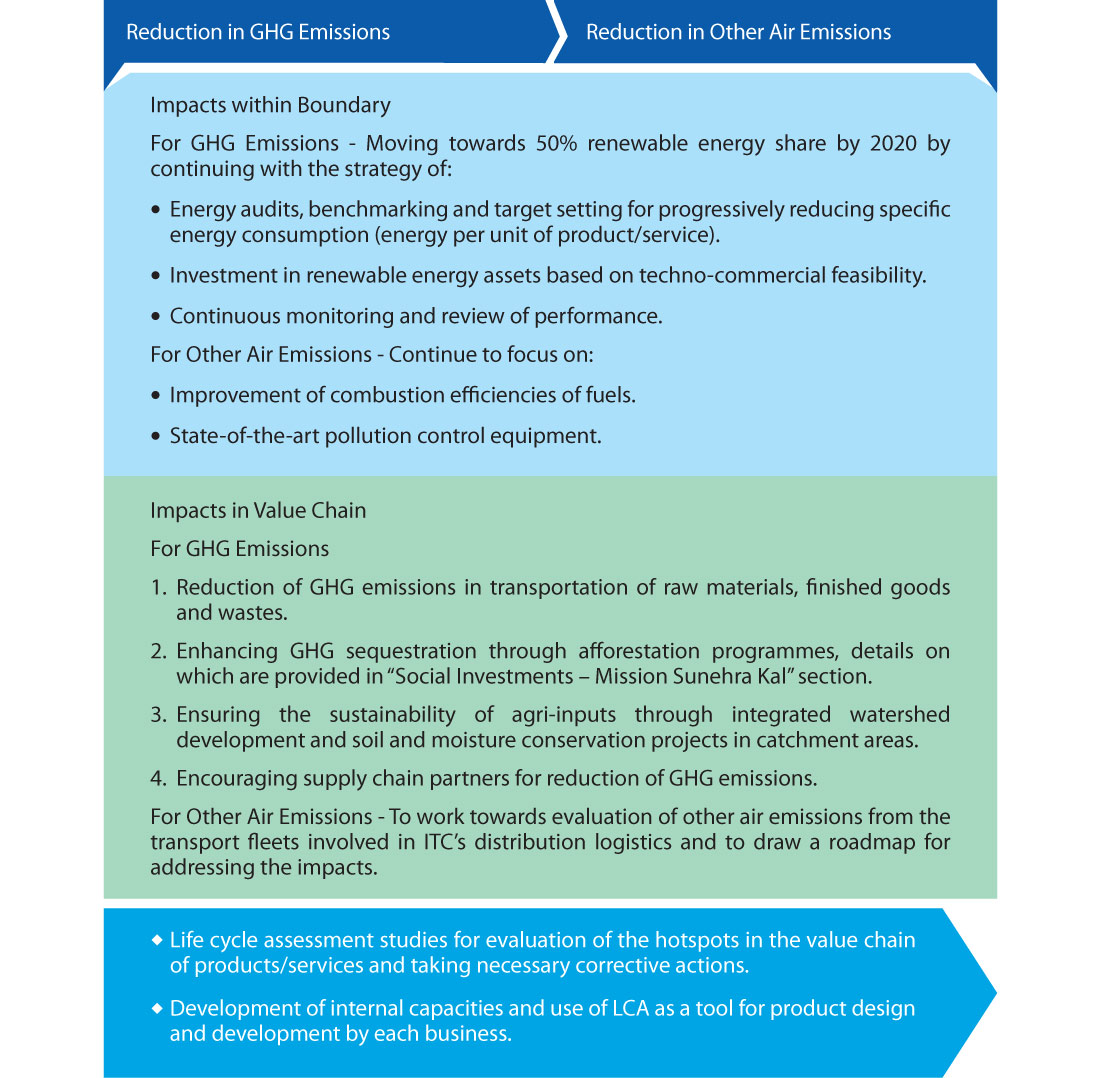
ITC has mapped the various challenges arising from GHG and other air emissions that may impact its own operations or its stakeholders and devised strategies driven by Board approved policies addressing the various dimensions involved.

ITC's Performance on Greenhouse Gases

Expand All

ITC's Performance on Greenhouse Gases

Based on applicability, ITC has accounted for the following gases in its GHG inventory: Carbon Dioxide (CO2), Methane (CH4), Nitrous Oxide (N2O), Hydrofluorocarbons (HFCs), Perfluorocarbons (PFCs) and Sulphur Hexafluoride (SF6). Provided below is a comparison of ITC's GHG inventory for 2014- 15 with that for 2013-14:

ITC has computed its greenhouse gas (GHG) inventory, including GHG emissions, biogenic carbon dioxide (CO2) emissions and GHG removals, in accordance with ISO 14064:2006, which is the latest international standard specifying principles and requirements at the organisation level for quantification and reporting of GHG emissions and removals. The 2014-15 inventory has been verified by KPMG at the "Reasonable Assurance" level.

All above figures are rounded off and are in kilotonnes.

Deviations in GHG emissions between 2014-15 and 2013-14 are primarily attributable to the following factors:

Decrease in Direct GHG (Scope 1) emissions
Increase in CO2 emissions from combustion of biomass
  • Increased utilisation of biomass as fuel in the Paperboards and Specialty Papers Business Units
  • Inclusion of CO2 emissions from indirect sources of renewable energy in the form of:
    • Purchased steam generated from biomass in Pune Unit of Foods Business and Bengaluru Unit of Cigarettes Business,
    • Purchased electricity generated from biomass in ITC Kakatiya, a subsidiary unit
Increase in Energy Indirect GHG (Scope 2) emissions
  • Inclusion of additional Units / activities into the reporting boundary as detailed in the "Energy" section of this Report
Decrease in Other Indirect GHG (Scope 3) emissions
  • Primarily due to reduction in imported raw materials and optimisation of transportation logistics

ITC's efforts in energy reduction across various Units have helped control GHG emissions in 2014-15. In 2014-15, 25,845 tonnes of GHG emissions (scope 1 & 2) were avoided by the:

  • Implementation of energy conservation measures leading to savings in both direct and indirect energy, and
  • Fuel switching measures. (Please refer to Energy consumption within ITC across Businesses in the "Energy" section for details on renewable energy share of each Business):

* Dip in CO2 sequestration in 2010-11 caused by reduced productivity of Eucalyptus plantations due to infestation in some areas and lesser incremental addition of plantation area.
* Dip in CO2 sequestration numbers in 2012-13 is primarily due to the revision in methodology of computing CO2 sequestration in order to comply with ISO 14064:2006 requirements.
* Increase in CO2 sequestration in 2013-14 and 2014-15 is primarily due to increase in the planted area of Subabul and Casuarina species as compared to the previous years.

Targets and Performance

In order to continually improve upon GHG emissions performance, some of ITC's Businesses have voluntarily set specific GHG emissions reduction targets at the Business/ Unit levels.

Since the Paperboards and Specialty Papers Business accounts for around 80% of ITC's total Scope 1 and 2 GHG emissions, focus has been directed at the specific GHG emissions (including Scope 1 and 2 emissions) against targets set for the manufacturing units of this Business:

Units of Paperboards and Specialty Papers Business
Specific GHG Emissions (in tCO2e/MT)
Actual 2013-14 Target for 2014-15 Actual for 2014-15
Comparison against target Comparison against last year Remarks
Bhadrachalam 1.67* 1.67 1.56 7% lower 7% decrease - Increased production of pulp to replace imported pulp, which led to higher generation of black liquor and subsequent combustion in soda recovery boilers
- Energy conservation measures e.g. replacement of 3 vacuum pumps with one energy efficient vacuum pump, optimisation of power consumption of high capacity motors by installing variable frequency drives, etc.
Kovai 1.08 1.08 0.79 27% lower 27% decrease - Energy conservation measures e.g. Improvement in boiler efficiency
- Higher utilisation of biomass fuels viz. wood chips, saw dust and de-oiled bran
Tribeni 4.79* 4.70 3.70 21% lower 23% decrease Energy conservation measures e.g. Replacement of 2 old boilers and turbines with new boiler and turbine resulting in efficiency improvement
Bollaram 0.10 0.098 0.15 53% higher 50% increase Non availability of gas-based power purchased from third party due to interstate wheeling problems between Andhra Pradesh and Telangana - This non-availability of electricity had to be compensated by electricity generated through in-house diesel generators.

* Values restated with respect to previous year's reported data: GHG emissions due to energy consumed in integrated township deducted while estimating specific GHG emissions (t CO2e per metric tonne of production)

G4-22

Impacts in the Value Chain

ITC's accounting of Scope 3 GHG emissions included monitoring and reporting of emissions from sources as depicted below.

ITC's efforts to optimise distribution logistics of finished goods for its FMCG Businesses have helped control GHG emissions in 2014-15. Specific Scope 3 emissions due to transportation of FMCG products (Cigarettes, Personal Care and Foods) in 2014-15 have decreased by around 5% (tonnes of CO2e emission/ tonne of product transported) as compared to the previous year for the same product categories. This has been achieved by improvement in vehicle utilisation capacity across the supply chain and extensive network de-layering in order to increase direct shipments to destination warehouses, thereby avoiding intermediate movements.

To set organisational boundaries for consolidated GHG emissions, ITC has utilised the operational control approach for the various entities covered under the Report. ITC's accounting of Scope 1, 2 & 3 GHG emissions is based on the 'GHG Protocol Corporate Accounting and Reporting Standard' and the 'GHG Protocol Corporate Value Chain (Scope 3) Accounting and Reporting Standard' issued by the World Resources Institute (WRI) and the World Business Council for Sustainable Development (WBCSD).

The standards, methodologies, tools and assumptions used for quantification of the GHG emissions and removals by various sources, have been explained at length in the Annexure - Quantification Methodology: Energy and GHG Emissions.

G4-21

ITC's Performance on Other Significant Air Emissions

Expand All

ITC's Performance on Other Significant Air Emissions

All ITC Units monitor significant air emission parameters, such as Particulate Matter (PM), Nitrogen Oxides (NOx) and Sulphur Dioxide (SO2) on a regular basis to ensure compliance with internal norms that are more stringent than regulatory requirements.

The decrease in the total emissions over last year was primarily due to the continuous interventions undertaken in Paperboards and Specialty Papers Business (which contributed 82% of the total air emissions in ITC during 2014-15) towards improvement in fuel combustion efficiencies and air emission control measures

Snapshot of Bhadrachalam Unit's performance

Owing to the continuous initiatives undertaken, there has been a consistent decrease in specific air emissions in terms of particulate matter, NOx and SO2 emissions for the Bhadrachalam unit.

Particulate matter emission for Bhadrachalam has reduced by 57% from 1.54 kg/BDMT of production in 2009-10 to 0.66 kg/BDMT of production in 2014-15. As per the Centre for Science & Environment (Source : All About Paper - The life cycle of Indian Pulp and Paper Industry, Green Rating Project, 2004), the average particulate emission by large scale Indian Mills is 3.8kg/BDMT.

NOx and SO2 Emissions

  Standards for NOx (kg/tonne) Standards for SO2 (kg/tonne)
Sweden 1.2-2.4 0.5-1.4
EU 1.0-1.8 0.1-0.5
EU-BAT* 1.0-1.5 0.2-0.4
Reported Values  
CEPI** 0.73 0.157

Sources - 1. Comprehensive Industry Document for Large-Scale Pulp & Paper Mills study by CPPRI, published by CPCB, 2007
*EU-BAT: EU Norm Best Available technology
2. ** CEPI - Confederation of European Paper Industries (CEPI) Sustainability Report 2005 reported the average specific SO2 and specific NOx values for European Paper Industries in 2002; CEPI Sustainability Report 2013 indicated the reduction in specific SO2 and NOx values for European Paper Industries from 2002 to 2012.

Hydrogen Sulphide Emissions

The primary source of hydrogen sulphide emissions in the integrated pulp and paper mill at Bhadrachalam is the soda recovery boilers in which black liquor is used to produce steam and recover chemicals. In 2014-15, hydrogen sulphide emissions for the Unit have marginally increased in comparison to 2013-14 since the unit utilised an increased quantity of domestic wood resulting in higher generation of virgin pulp and in turn higher volumes of black liquor being combusted in the soda recovery boilers. However, the emission level is well below the regulatory norm.

Ozone Depleting Substances (ODS)

In 2014-15, the total consumption of ODS by all our Units was 108.7 kg of CFC-11 equivalent.

Responsible Management of Chemicals, Oils and Fuels

All ITC Units manage chemicals, oils and fuels as per norms defined by the Company, which take into account all statutory requirements and international best practices. These norms are taken into consideration right from the design stage and include measures for leakage/spillage prevention, provisions for containment, impervious flooring, leak detection system as well as all requirements as per Material Safety Data Sheets (MSDS) for hazardous chemicals. To avoid any incidence of uncontrolled spills or leakage, ITC has instituted safe work practices on handling and storage, procedures for leak detection & spill control and preventive maintenance. The effectiveness of these measures is checked on a regular basis.

We also continuously evaluate the feasibility of substituting hazardous chemicals with less or non-hazardous materials. In 2014-15, there was no significant spillage of any chemical, oil, fuel or hazardous waste in any of ITC's Units.

The Road Ahead

Water Management